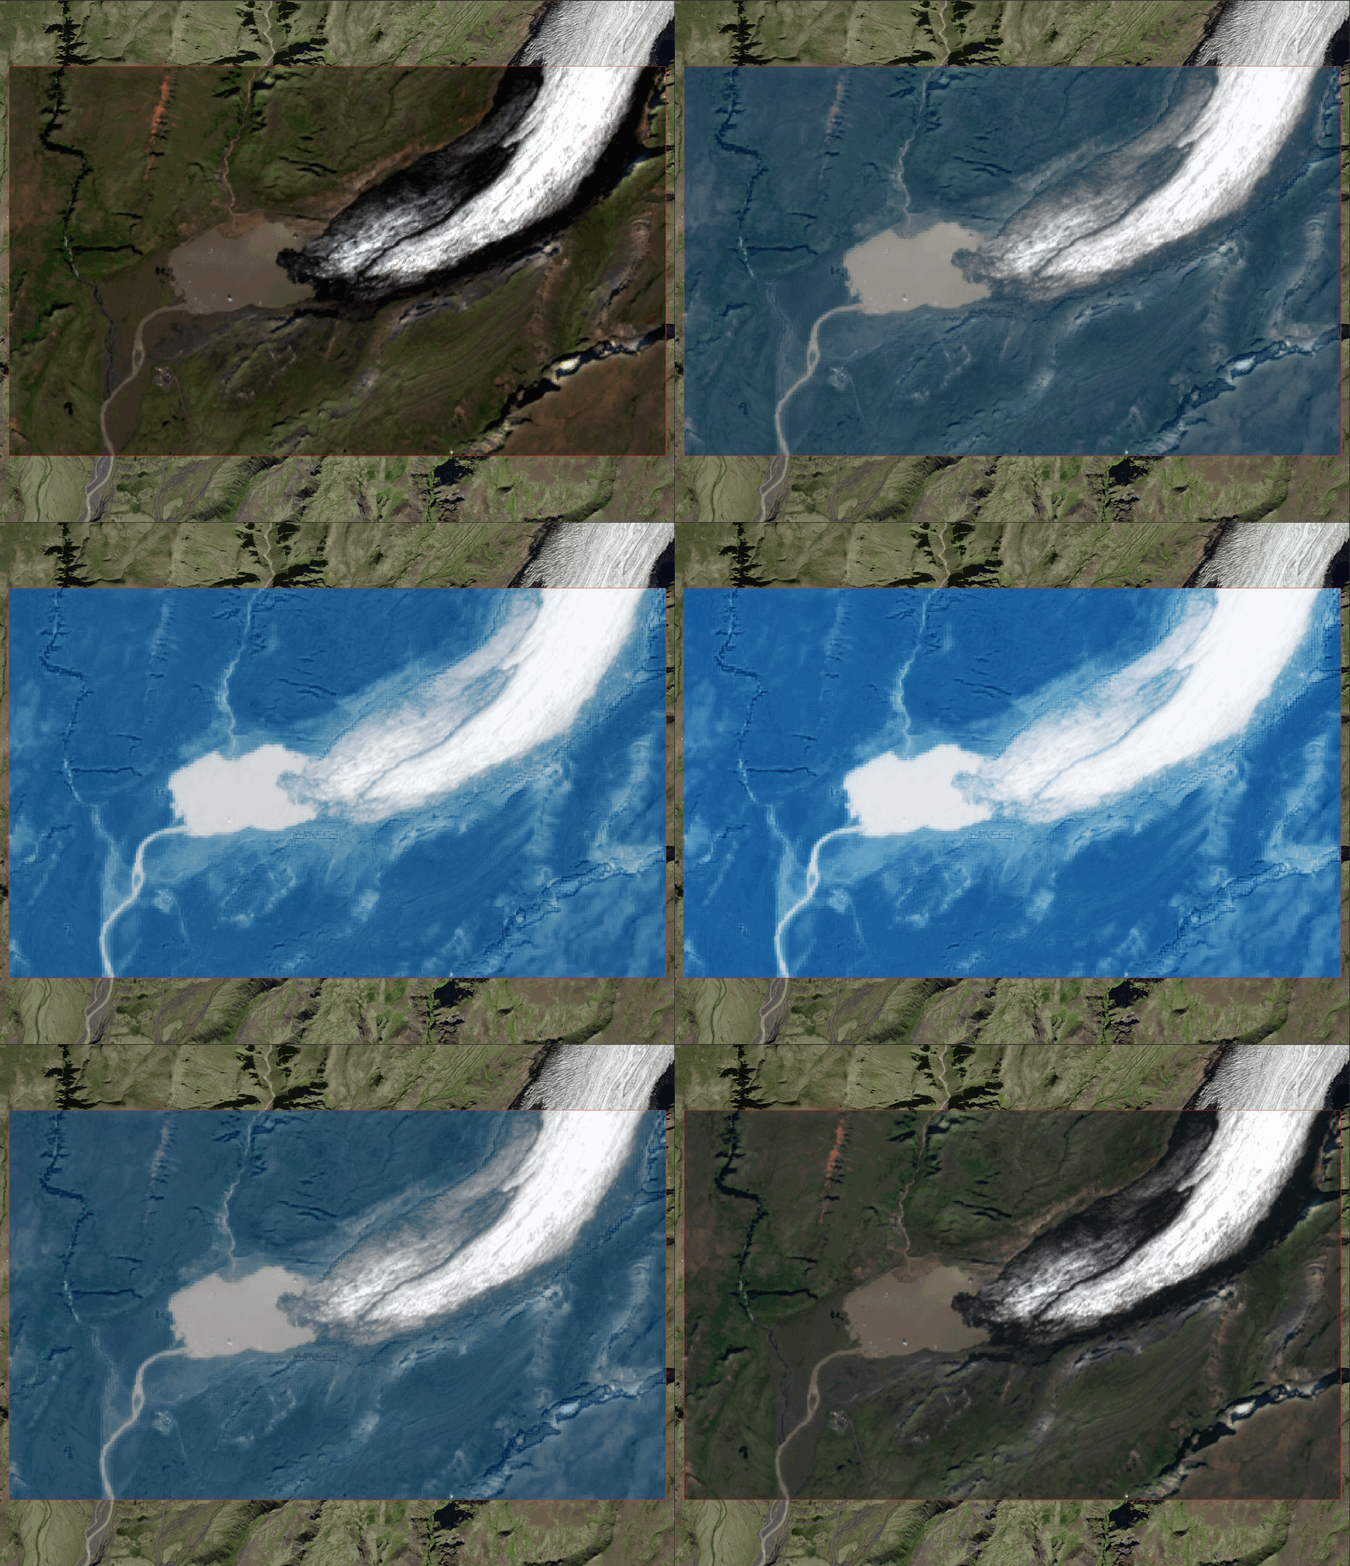
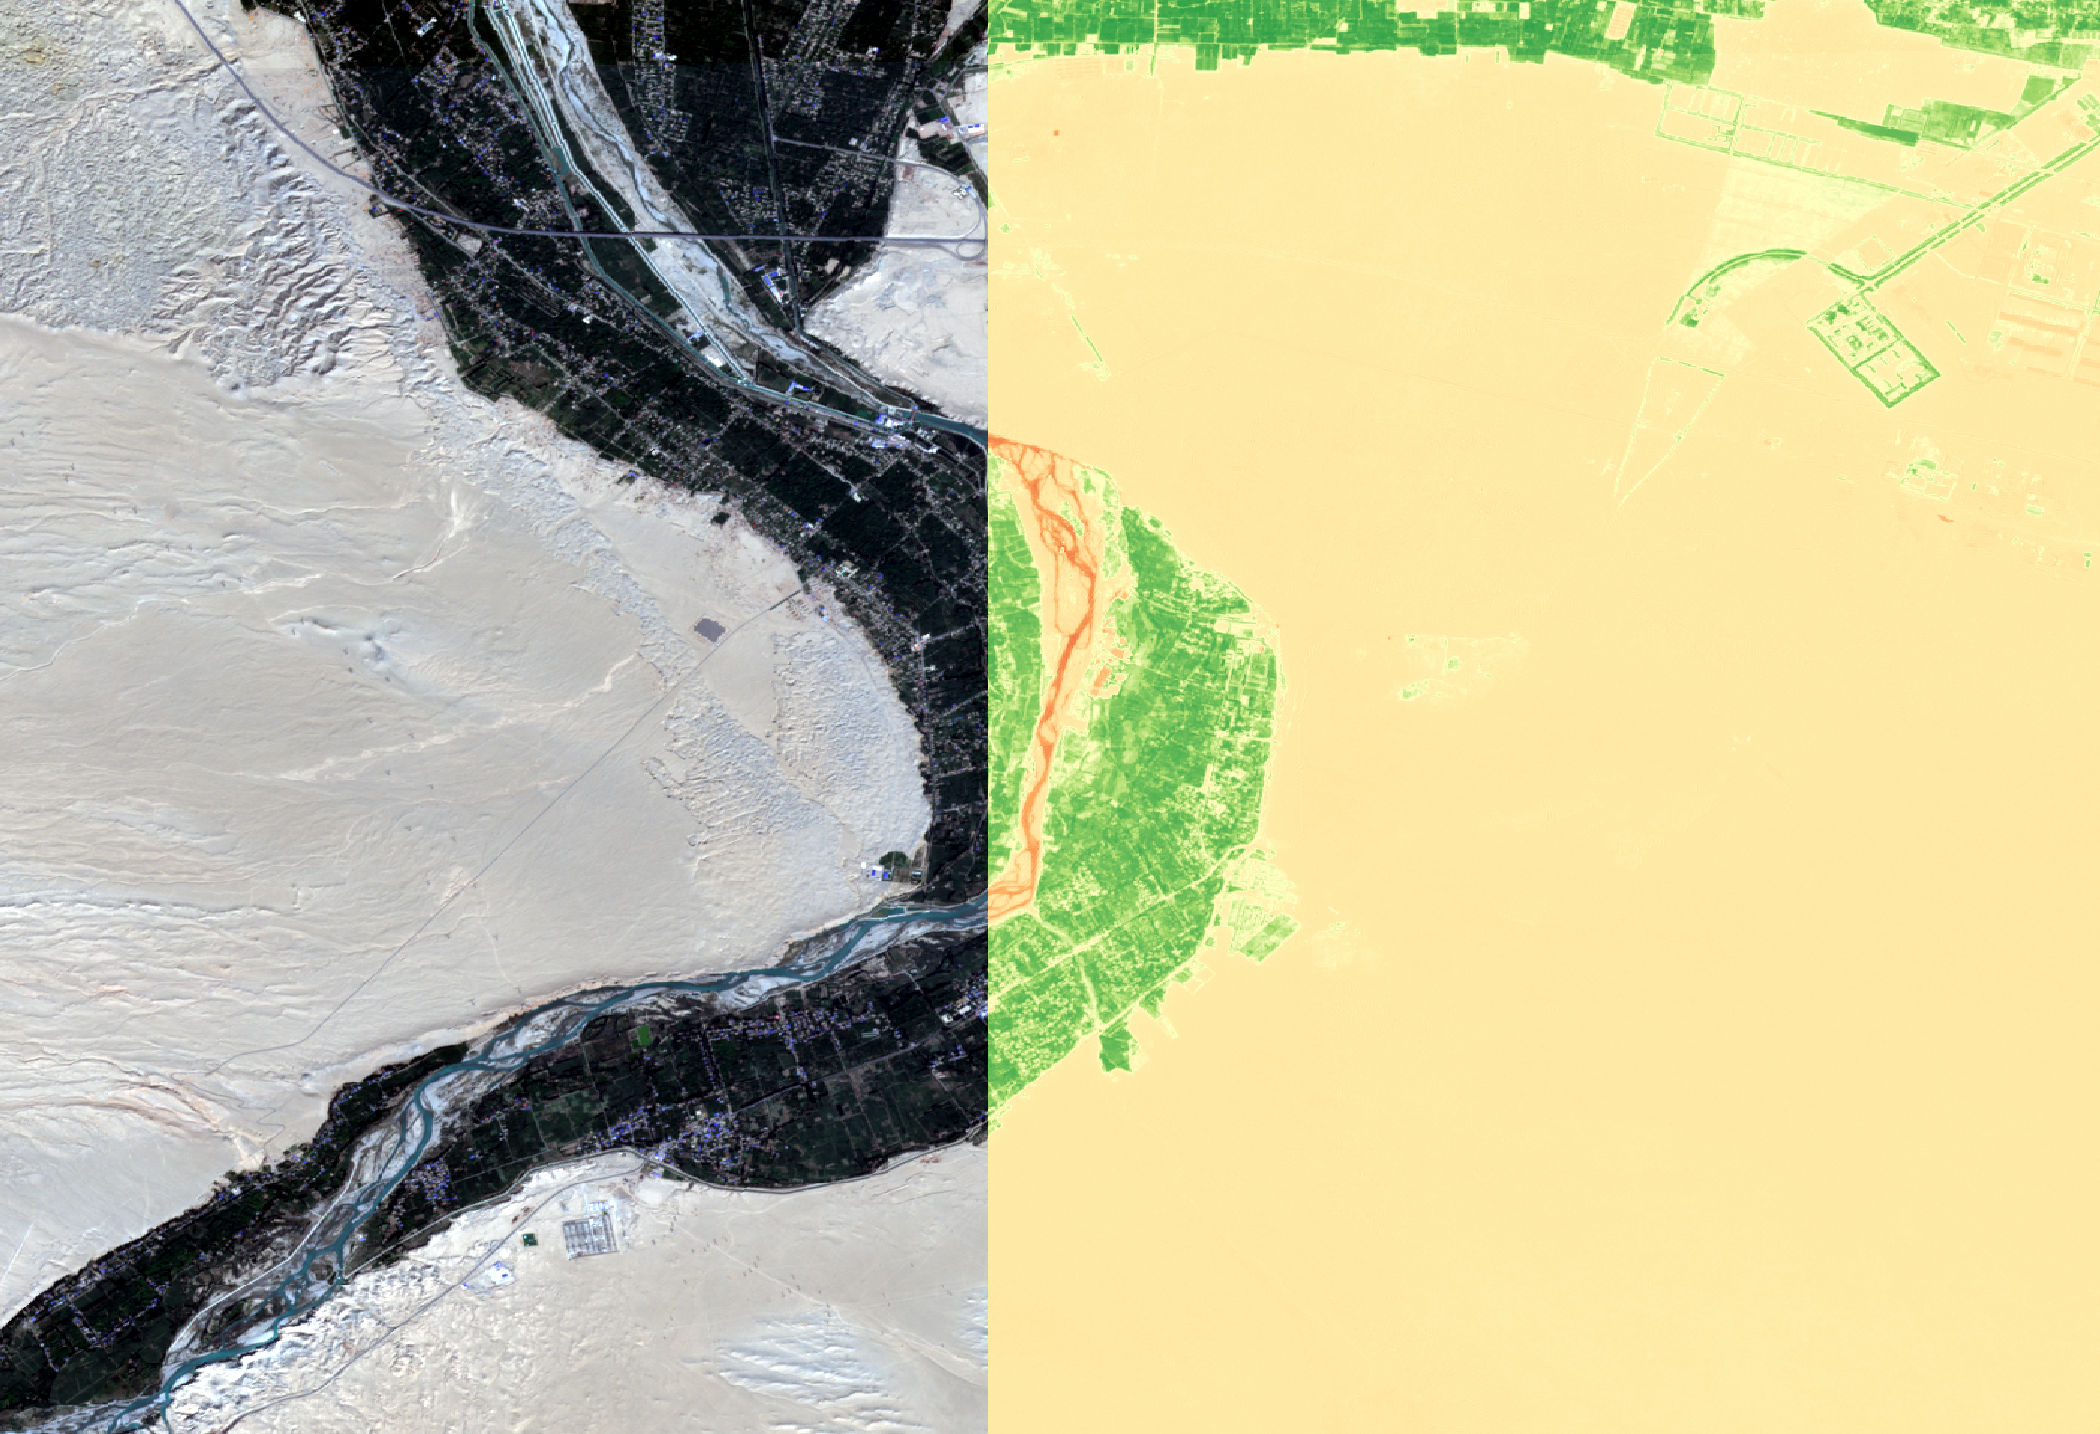
Sentinel-2 imagery provides high-resolution satellite data, capturing multispectral images of Earth's surface.
It is widely used for monitoring vegetation, land use, water bodies, and natural disasters.
The imagery offers up to 10-meter spatial resolution and covers 13 spectral bands, enabling detailed environmental analysis and land management.
The data collected by Sentinel-2 can be freely accessed using the CDSE through the Sentinel Hub either using the data browser or through the Sentinel Hub python library.
This page will go over:
The CDSE is a service providing free and instant access to a wide range of services within the Copernicus Sentinel missions.
The service has a built-in browser for viewing and downloading data manually, as well as the option to pre-process data prior to download.
For our needs, we will access the services through Python to facilitate downloading data on a large timescale and even region.
Once you have signed up to the service, navigate to My Account
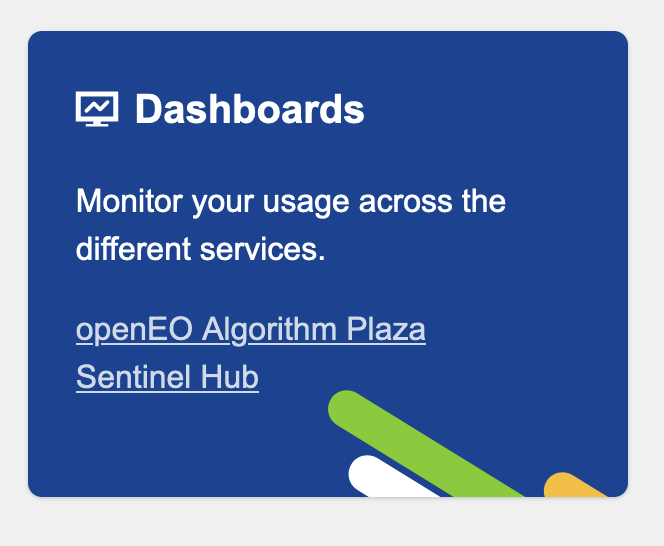
From here go to Sentinel Hub. We will need to set up an OAuth client here.
Navigate to User Settings at the lower left hand side of the screen. From here you want to create an OAuth client. We will use the details from this witihin the script to authenticate the download procedure.
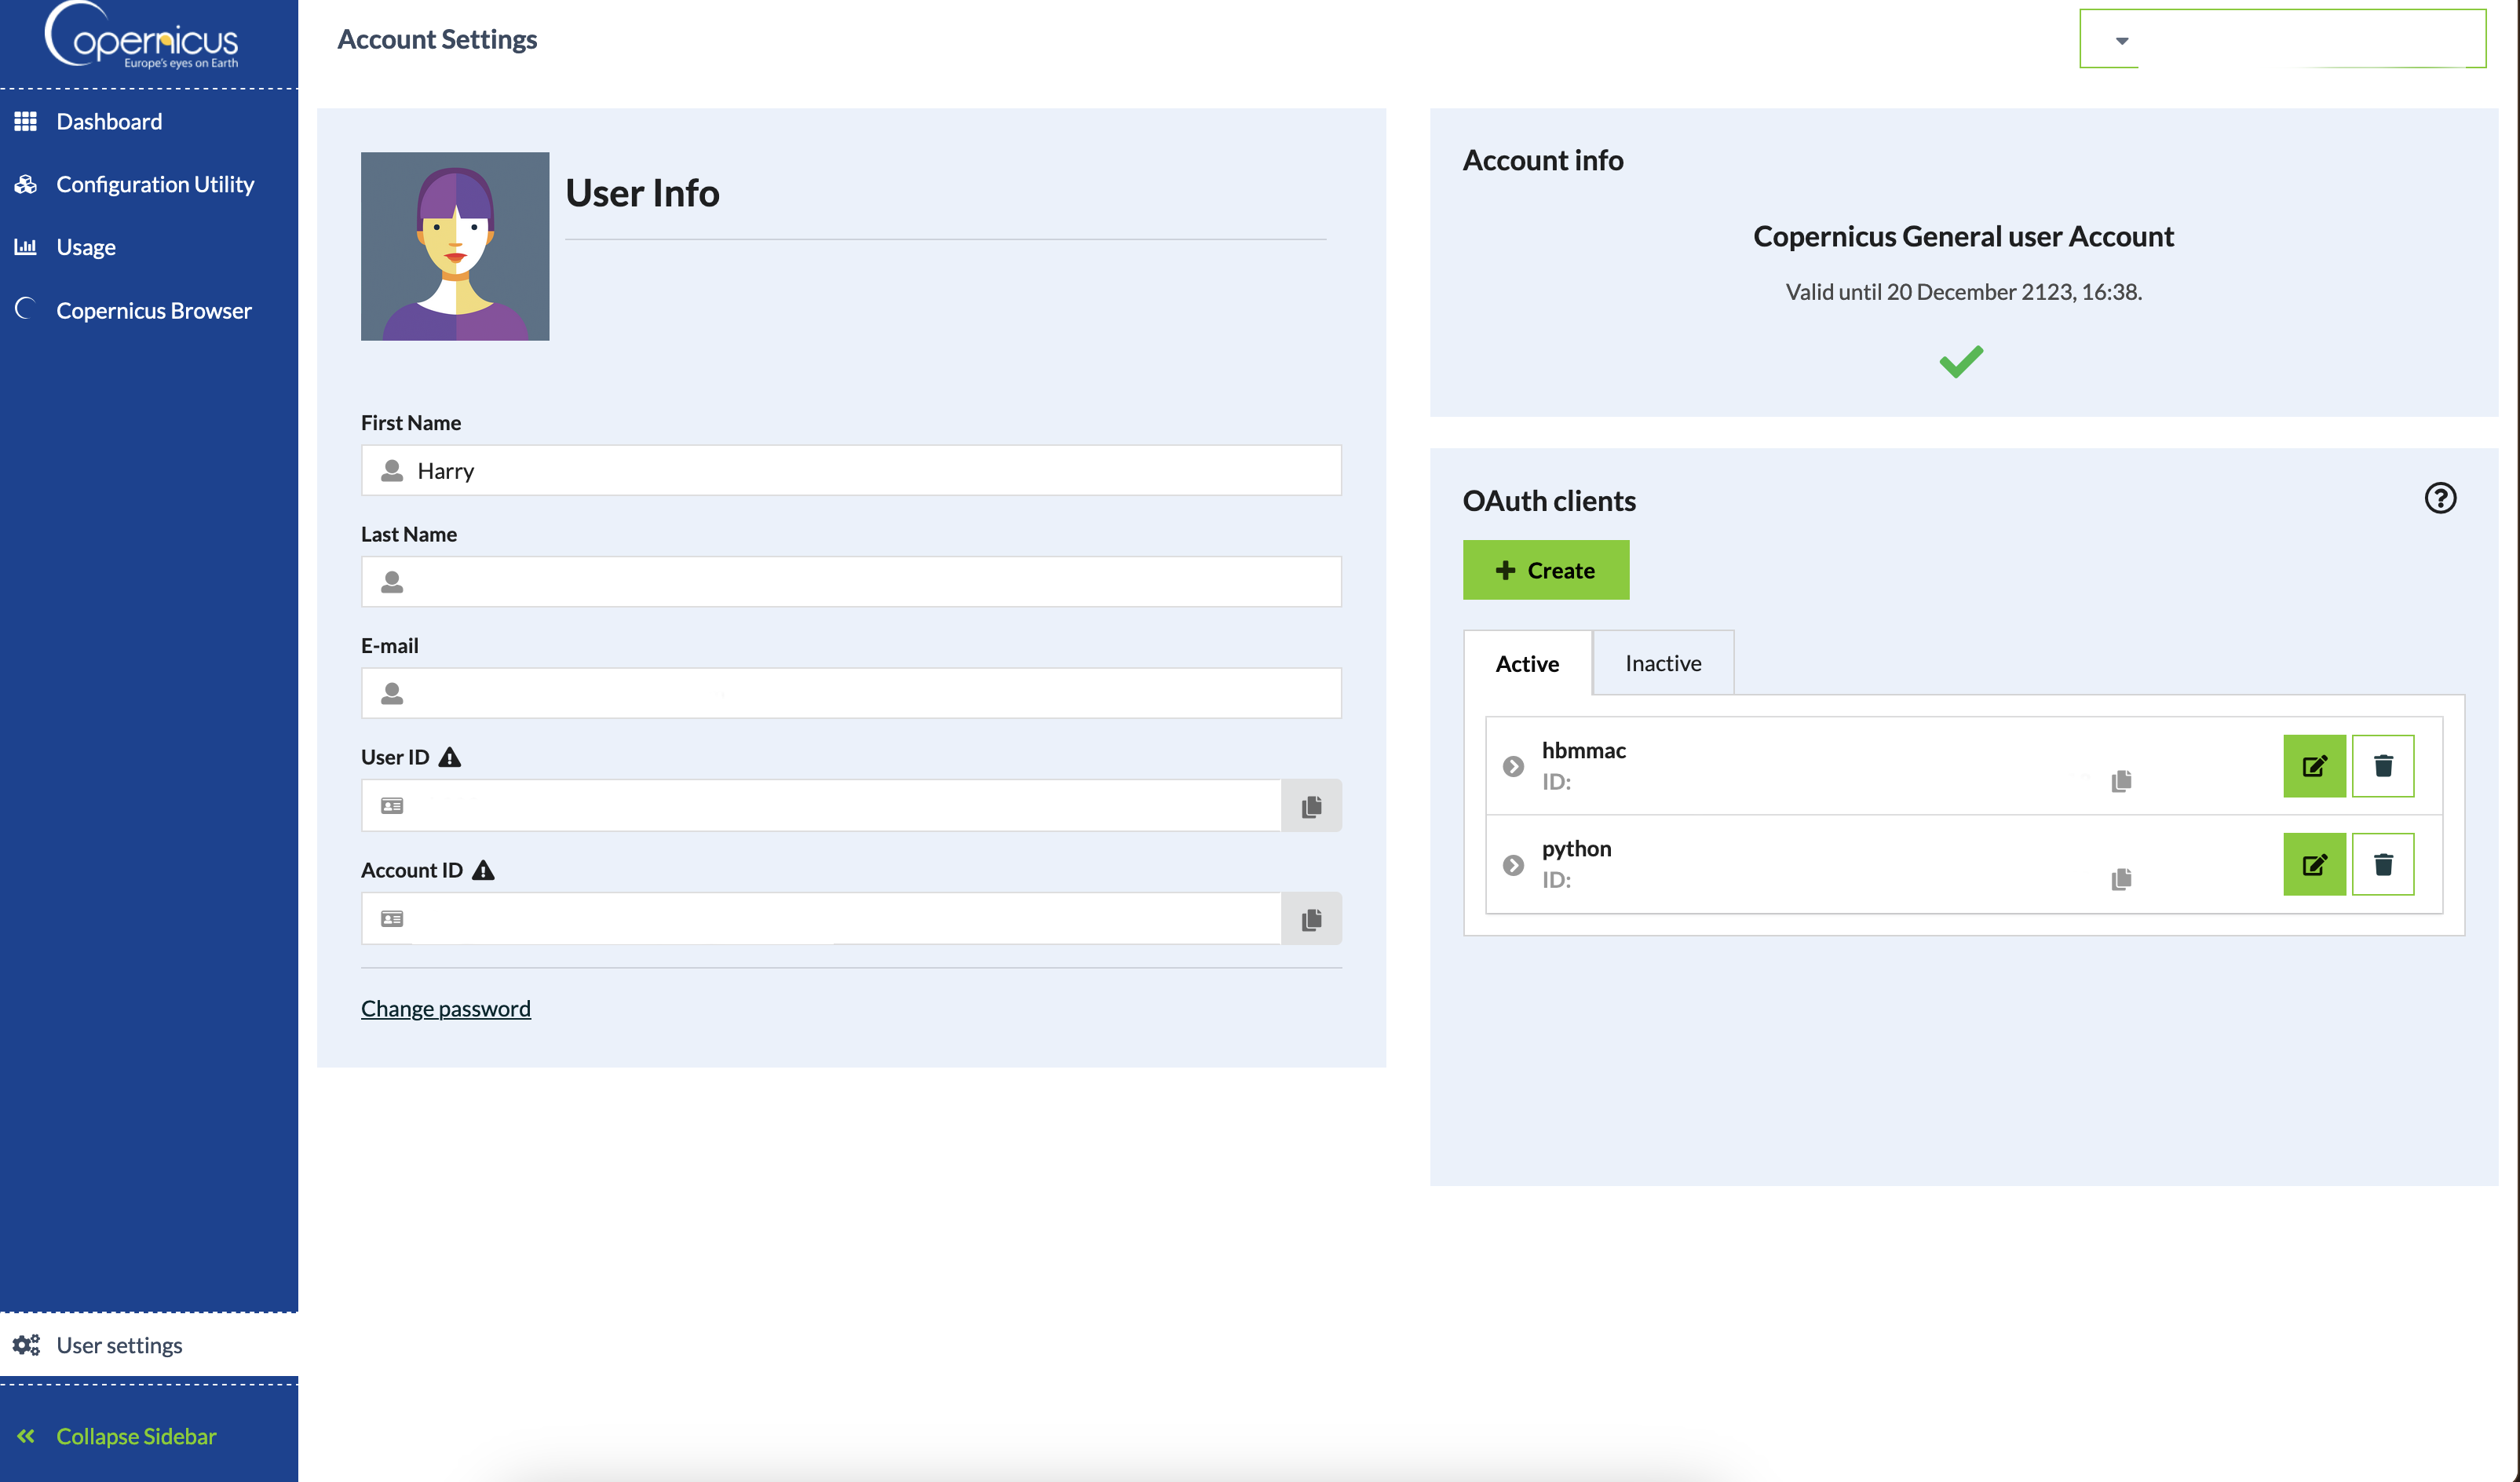
At the end of the setup you will be shown the Client ID and Client Secret. Both of these will be required for the Python script to work.
Keep a note of these for editing the script.
The configuration required for QGIS is relatively simple. First, we need to define an additional script library for the processing toolbox.
Once this has been done the processing script will appear in the toolbox under the Scripts -> Sentinel Scripts section.
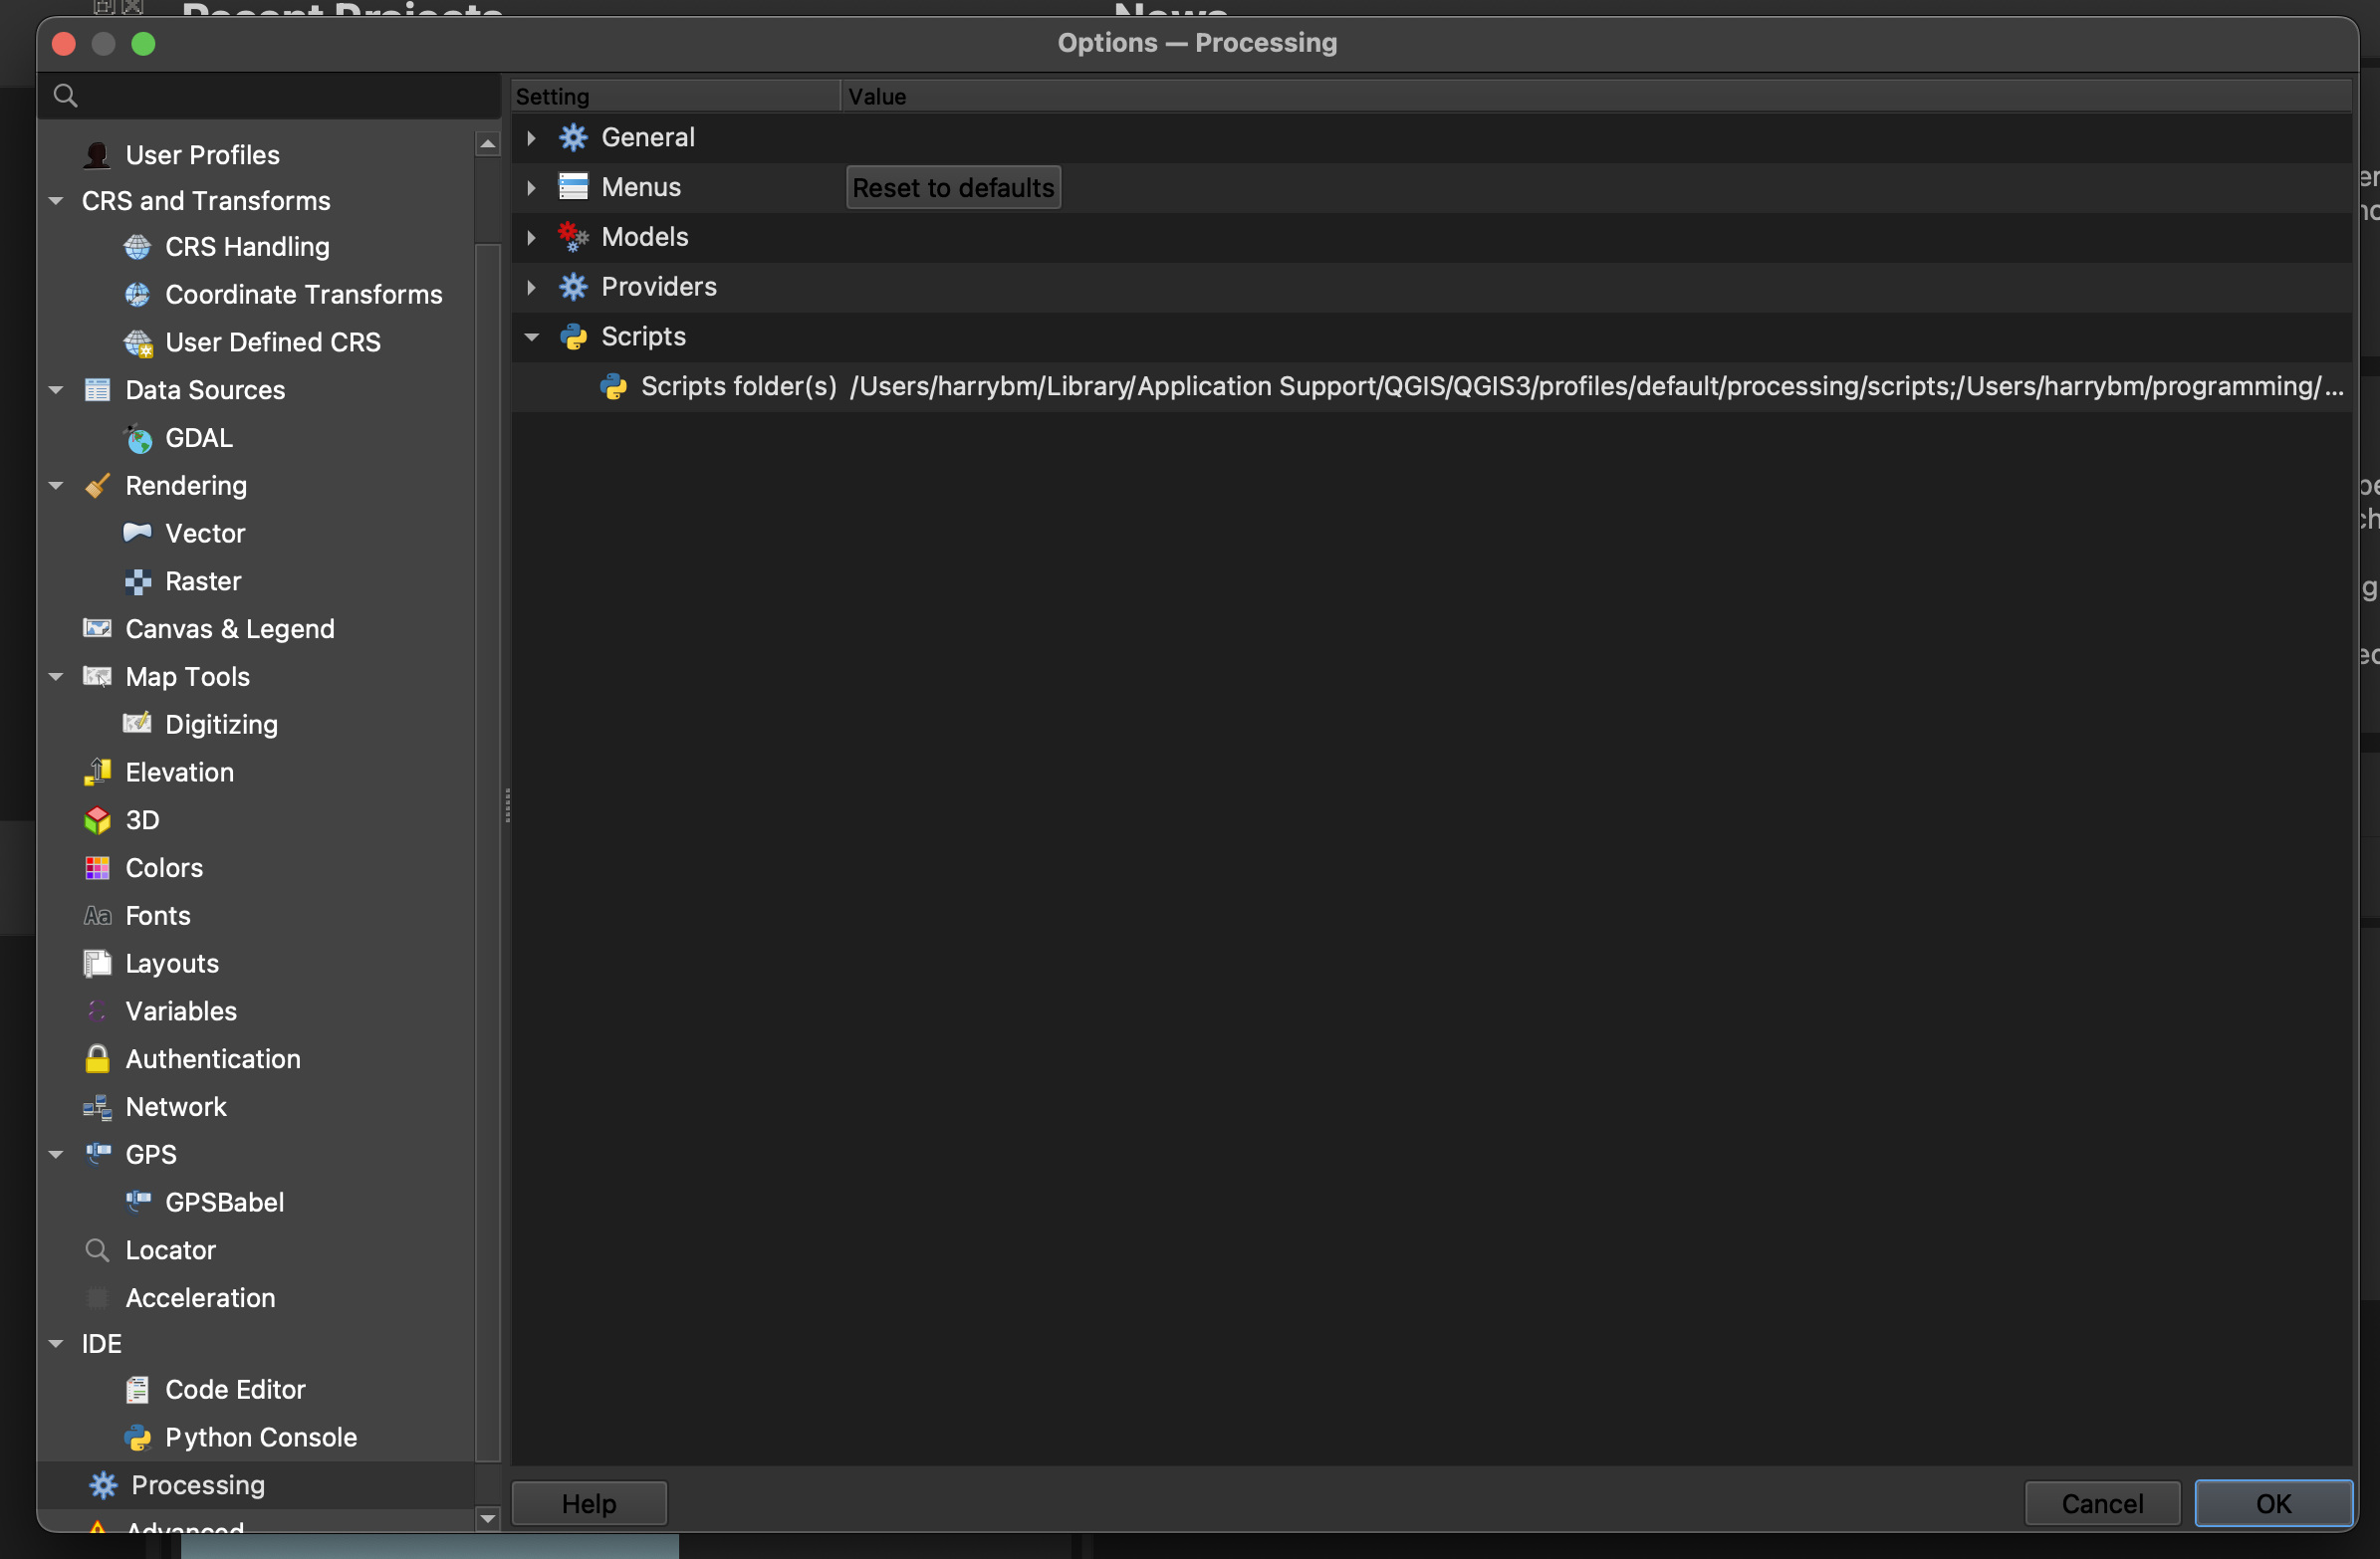
To do this, have the processing toolbox open and click on the Options button. Inside of here, click on Scripts folder and then the three dots to add a new folder. Navigate to wherever the script will be kept. Add this folder as a custom script folder.
Next QGIS needs to install the python library 'sentinelhub'. To do this, open the python console in QGIS and enter the following commands.
import pip
pip.main(['install ','sentinelhub'])
This will add the sentinelhub package to QGIS python library. After this the setup is ready for adjusting the script for use with your own credentials.
The final step is to edit the script. The full script will be copied below with a link to download also provided. In regard to the lines that require changing they are 188 + 189:
config.sh_client_id = "{your id}"
config.sh_client_secret = "{your client secret}"
Once these two lines have been edited to fit your OAuth details the script is ready for use within QGIS.
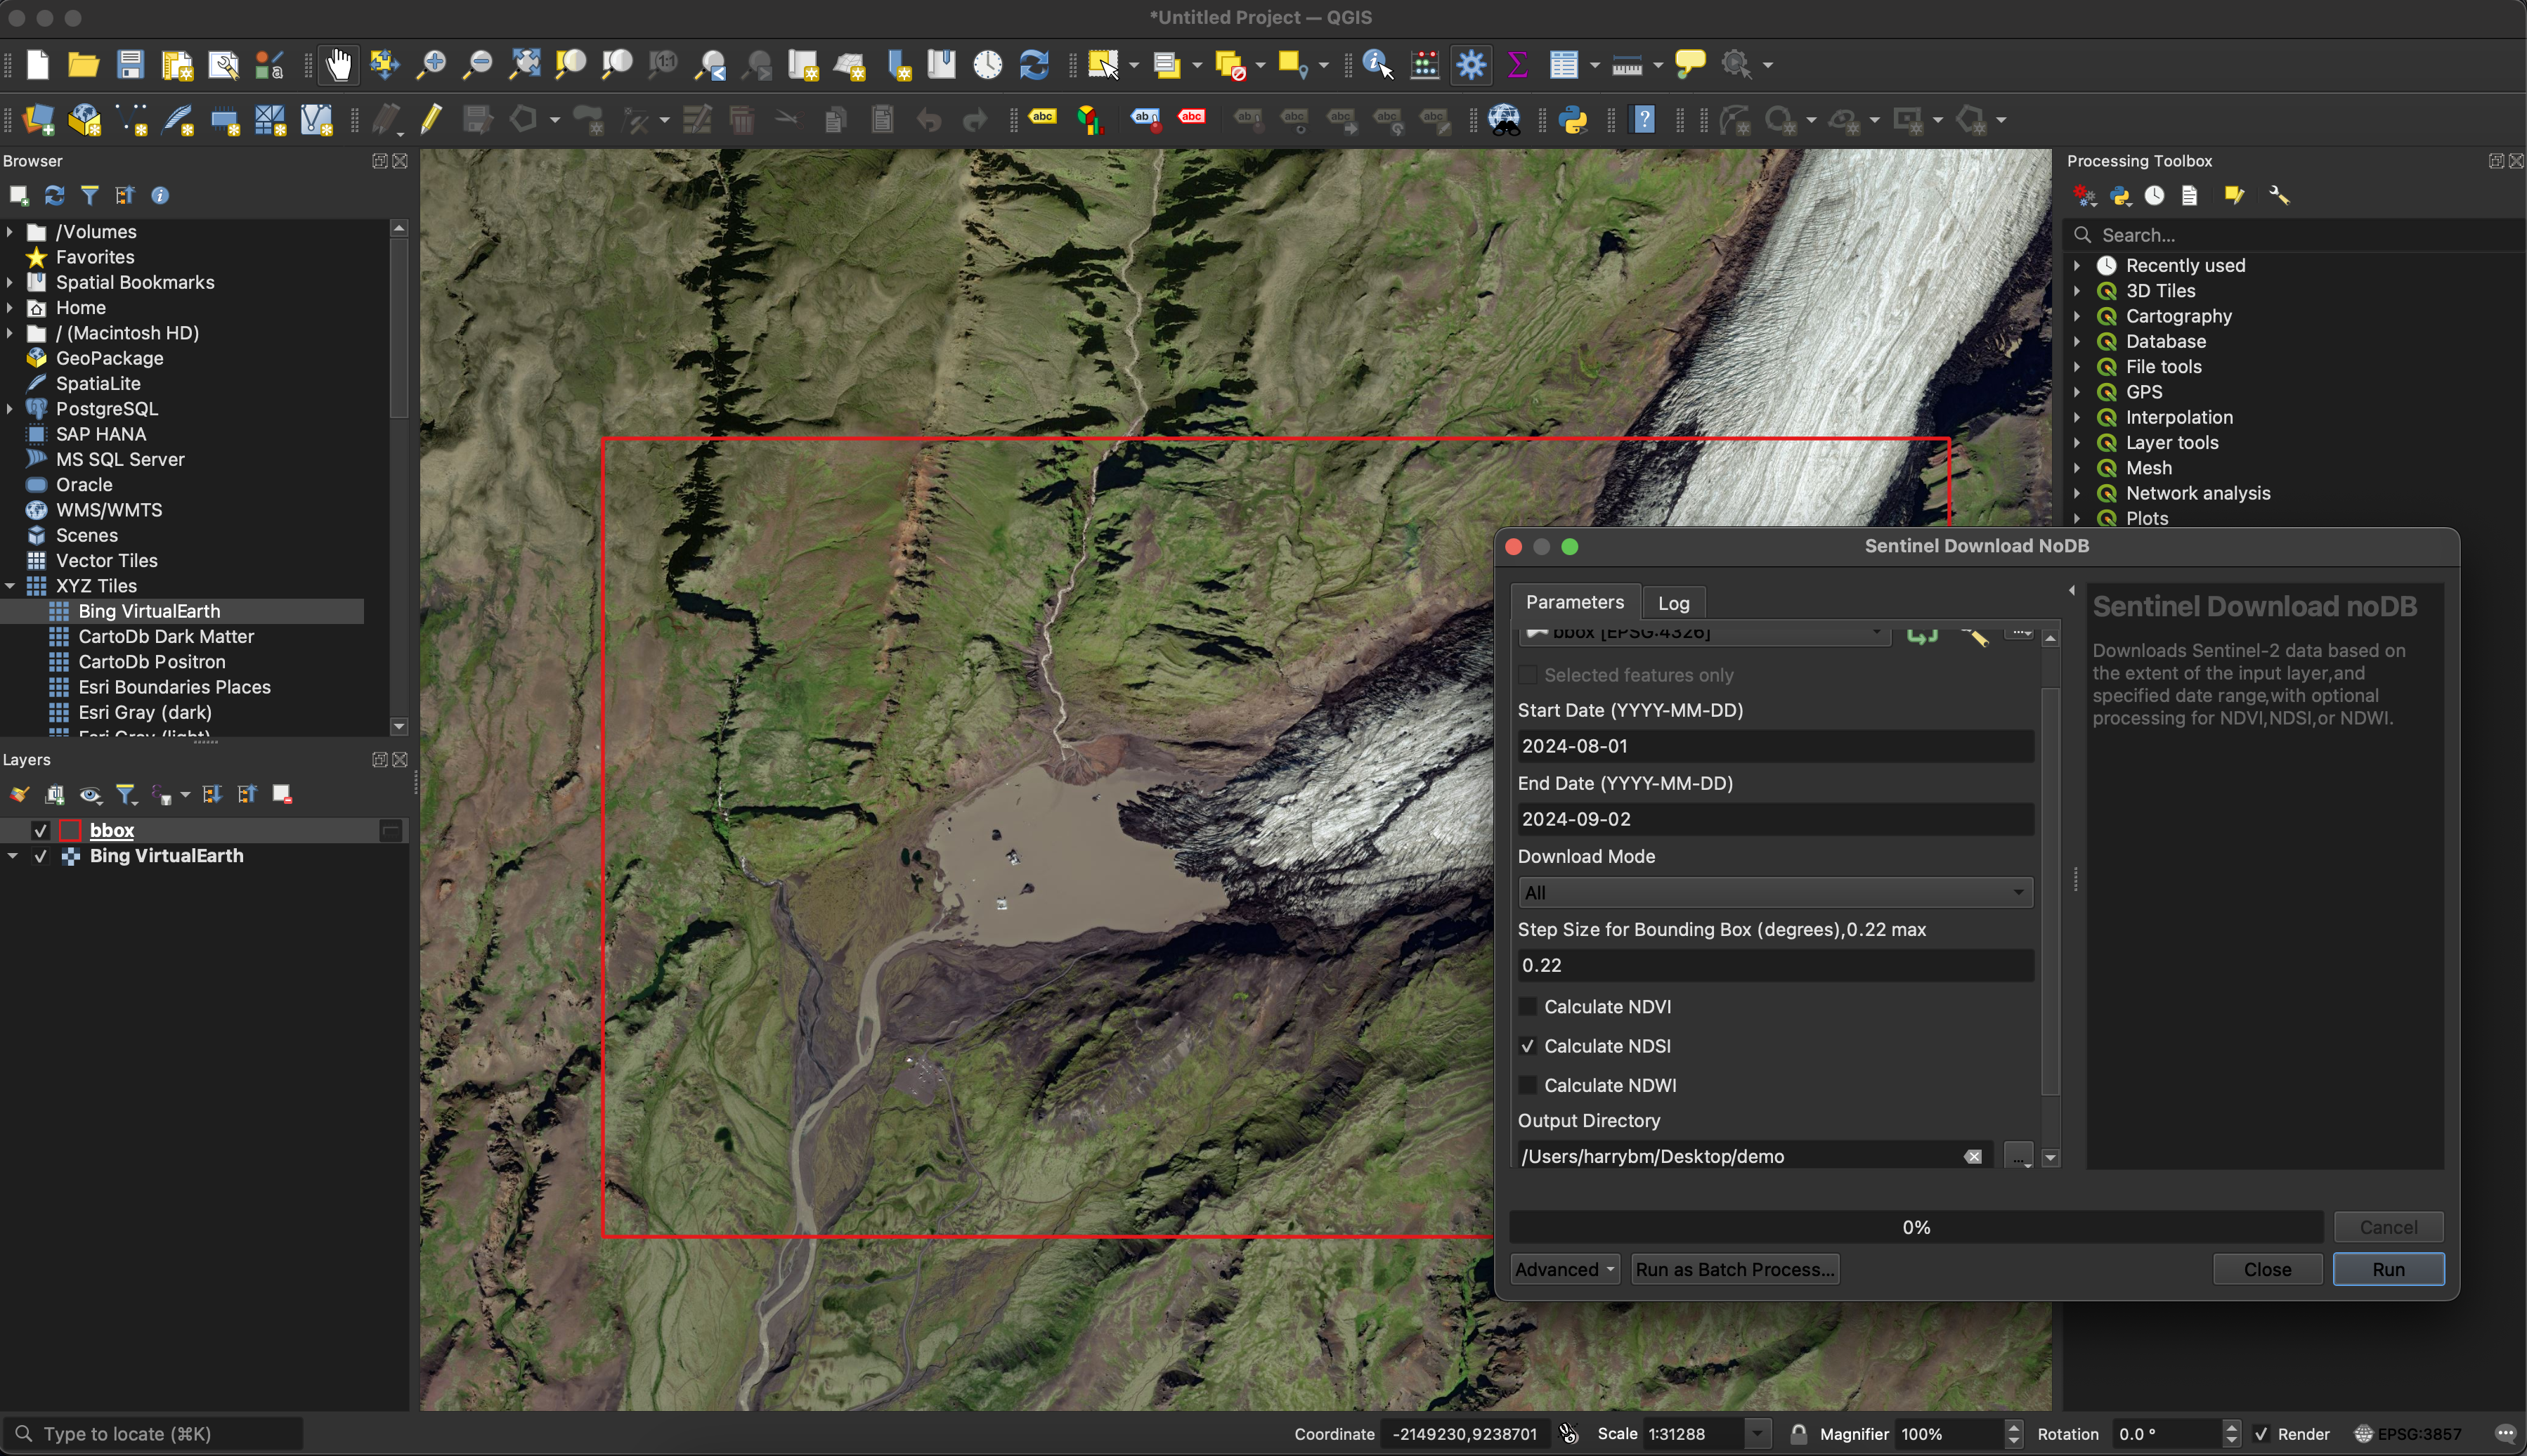
The script takes a layer as an input. For this I use a temporary polygon layer, but you may have a bbox from a client or for an area of interest.
A date range is then input by the user. The download mode gives the option to receive all files between this date range, or instead a monthly image.
The step size is for the x,y limits of bounding boxes for larger downloads. For some reason, alrger than 0.22 decimal degrees breaks the script as the area is too large.
As a result, the script downloads in generate bounding boxes. These are automatically calculated to cover the full extent of the input layer.
Below the step size are a few options for processing the downloaded images. This happens locally using GDAL and so no processing tokens are used up on sentinel hub.
Ticking any of these options will apply this process to all downlaoded images, so both the raw data with all 13 bands as well as a processed .tiff file are generated.
An output directory is required to be specified for where the files will be downloaded. Within this the calculated bounding boxes will be generated, inside which the files are downloaded as well as a 'files list' csv which contains a list of all the files the script is going to download for that bounding box.
If the download requires an area >1 bounding box, a composite folder is also generated where a merged composite is added for each date downloaded as well as any chosen processing.
The generated files can then be brought into QGIS or any other GIS for visualisation/further analysis.
Download the python tool with this link
