Blender is a free and open source piece of software most commonly used for 3D modelling and animation.
It offers a vast array of tools for producing anything you can imagine. With the inclusion of python scripting
this can be taken further and has been by domlysz on GitHub.
Blender GIS is an addon built to 'make the bridge
between Blender and geographic data'.
This will serve as a quick overview of features provided by the addon and a step-by-step installation process.
I will go over:
In my experience, the Blender GIS addon only works on specific versions. These versions vary depending if you're
on MacOS or Windows.
The versions I found to work were Blender 3.6 on Windows 10
and Blender 2.83 on MacOS Sonoma 14.2.1.
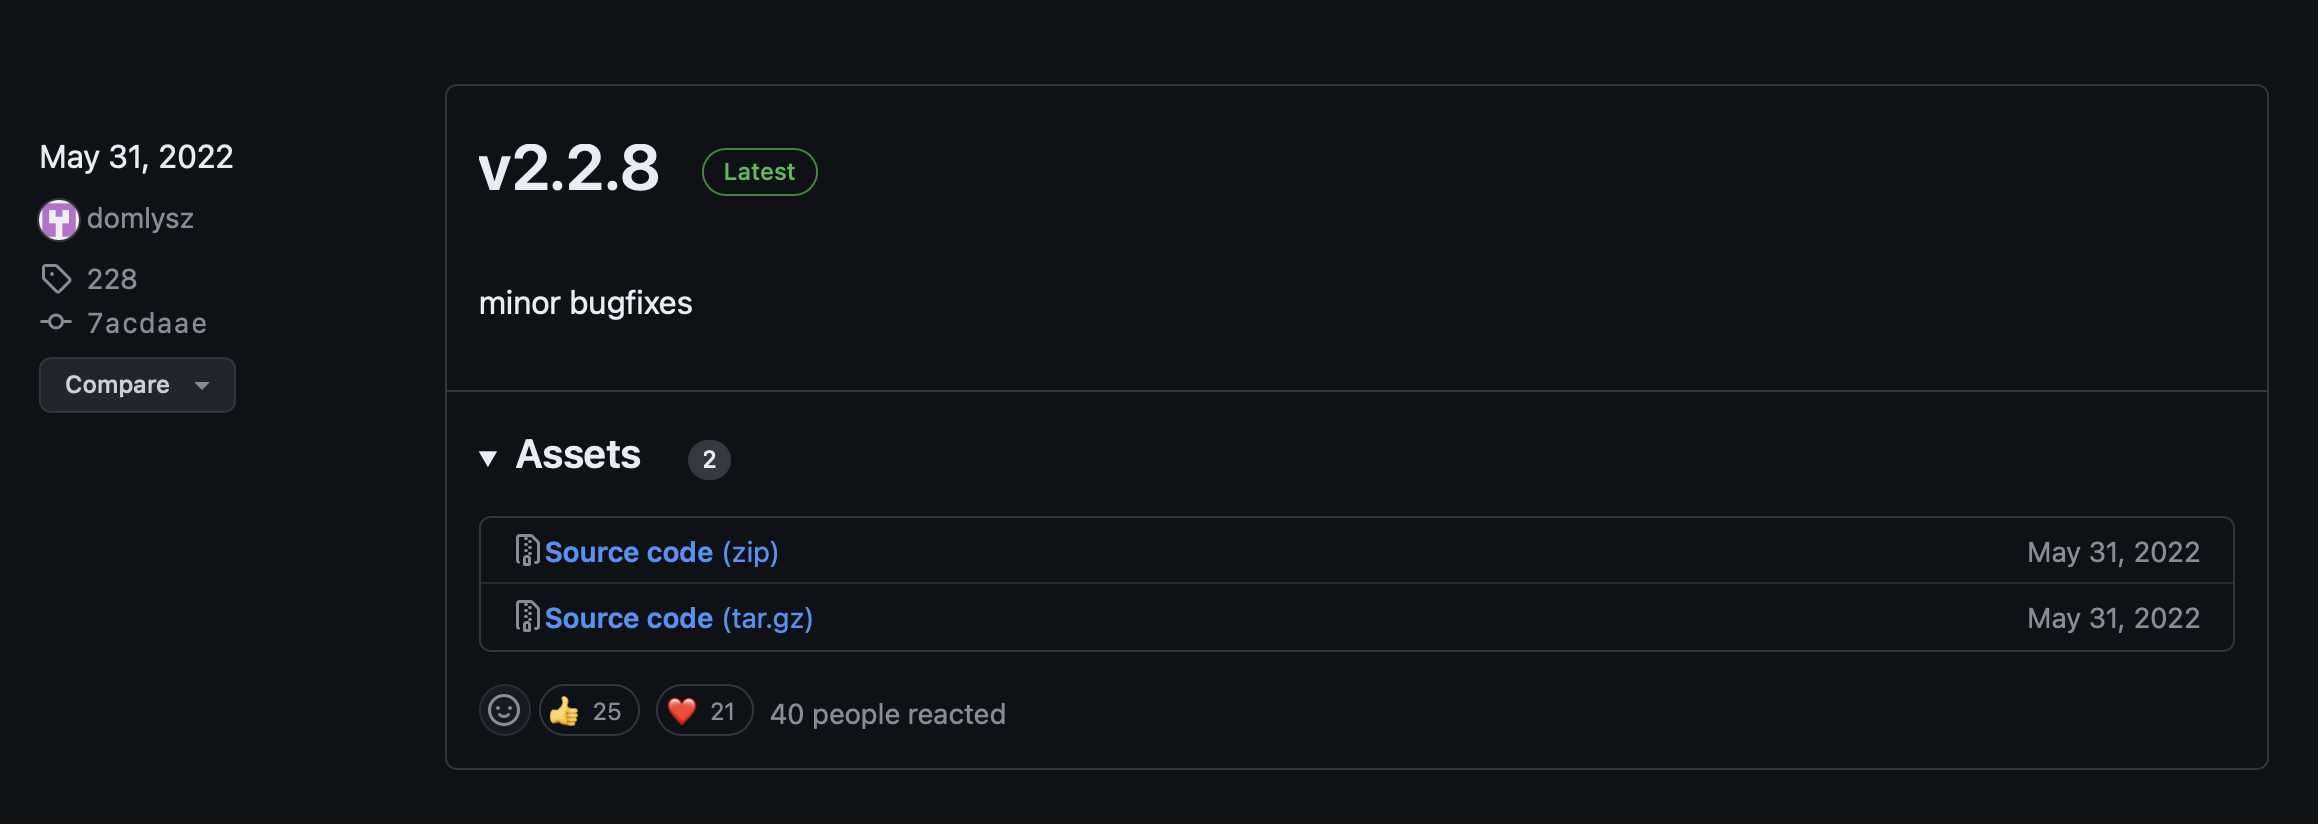
Once Blender is installed you are ready to download the addon. Go to the releases
tab and download v2.2.8 as a .zip file.
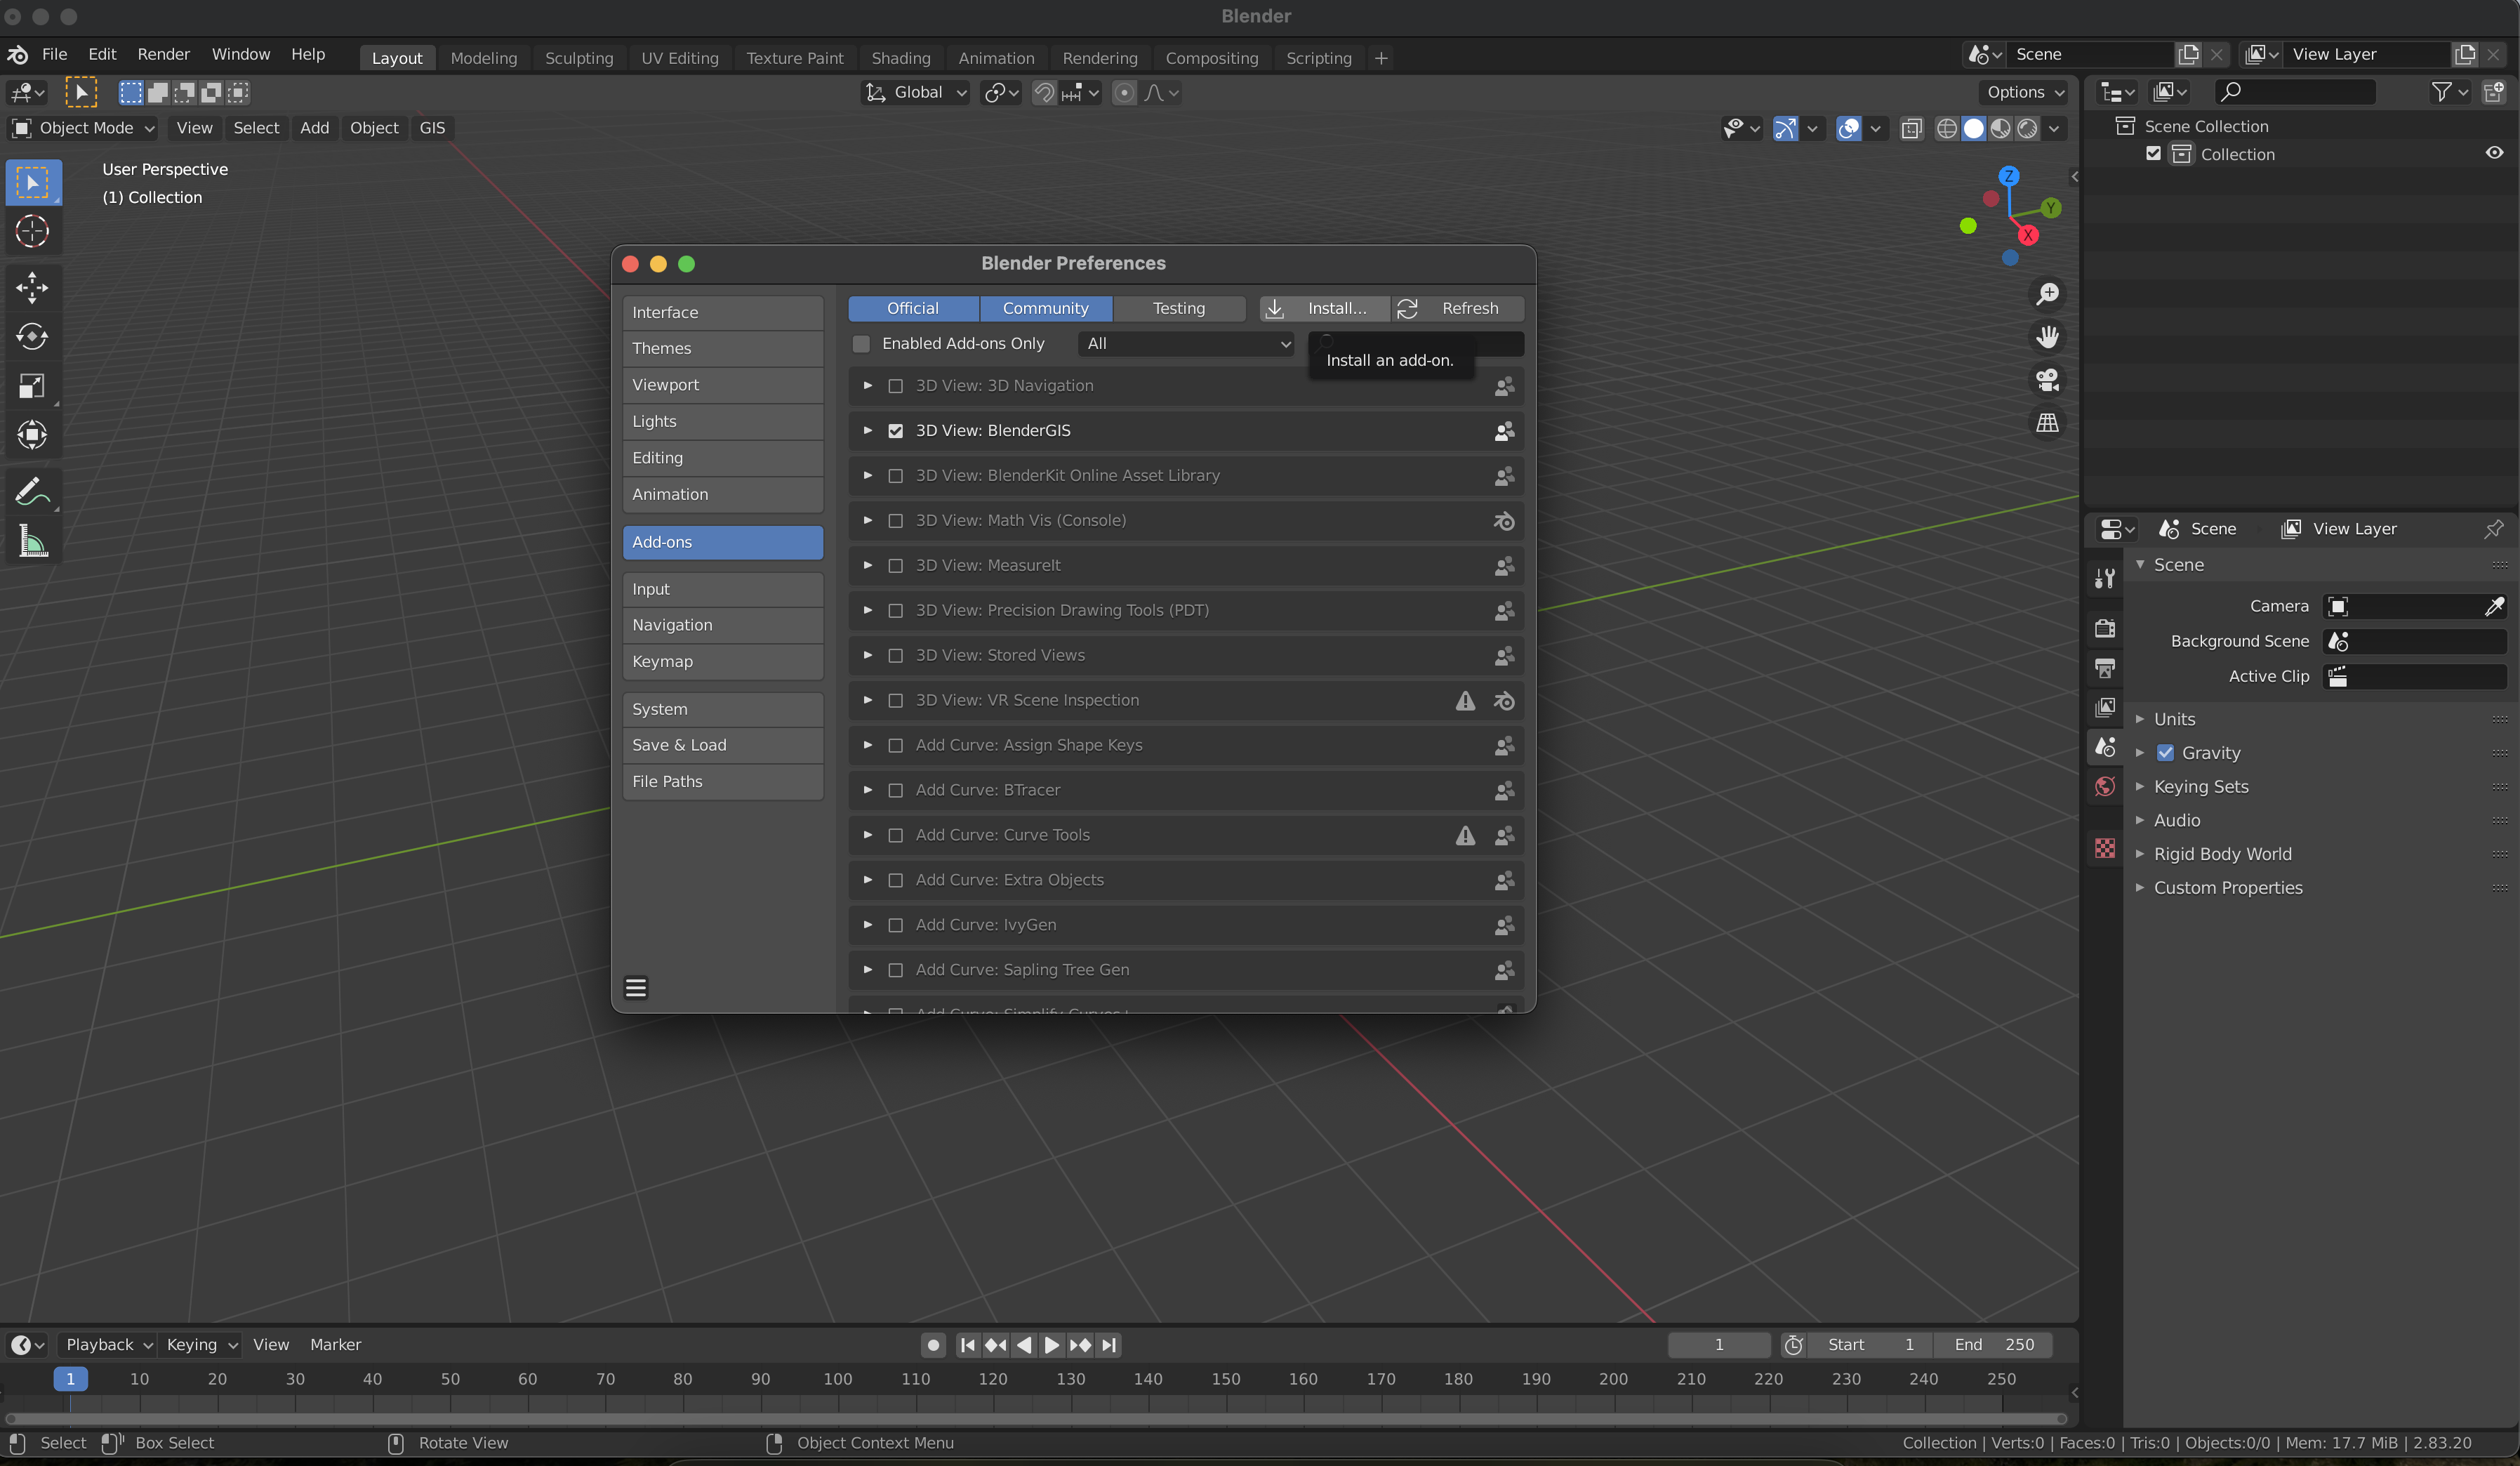
Now you're ready to install the addon. Open up blender and from the top bar go to Edit -> Preferences.
Once here go to addons, as shown below, and then to install. Here you want to select your .zip file from earlier and install it into Blender.
After doing this, ensure you have ticked BlenderGIS to enable it.
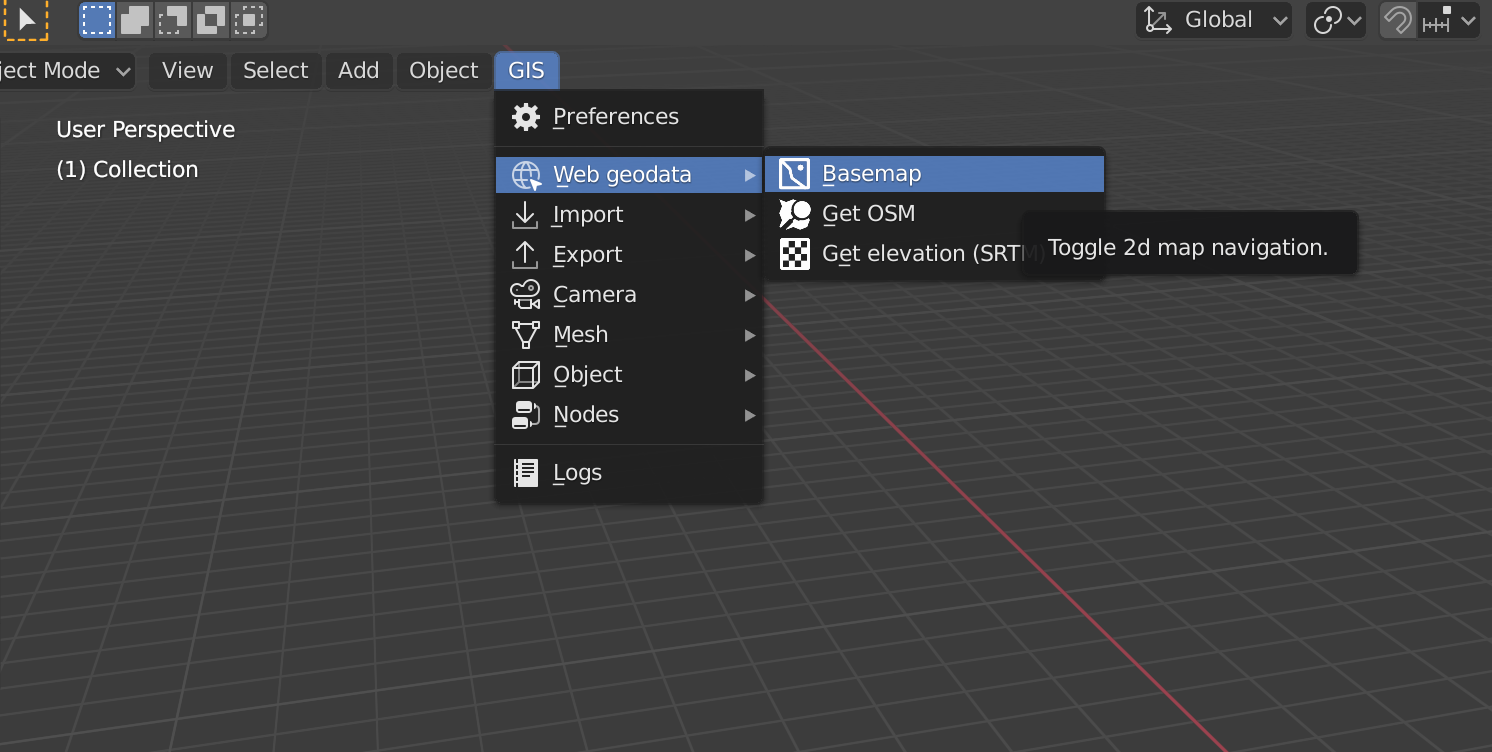
Now that the addon is installed, you will see that there is a new tab option titled "GIS". When clicking on this,
go down to Web geodata -> Basemap.
Here you will have the choice of a number of sources for imagery, in this example I will use Google Earth imagery.
The view will open up to the world, here you can zoom in to the location you and looking for. Middle mouse can be used for panning around.
Another option is to press G, this will bring up the search tool where you can specify a location and a
zoom amount.
As you zoom, more tiles will be loaded.
If you have a large area, the resolution may not be as good as you would wish. For this, you can press L which will lock the view.
From here you wont see the changes other than the number of tiles increasing, but you can continue to zoom in to increase the scroll level or by pressing Numpad +.
Increasing the zoom will increase the number of tiles for the mosaic when at a larger scale and produces a large file size.
Once you are happy with the selection you can press E to produce the mosaic. Depending on your computer or the size of the area, this could take a while.
Once this is complete you will see your selected area on a plane mesh in the 3D view.
In the same dropdown as the Basemap, we can find the Get Elevation.
This option uses OpenTopography and will require an account and
API key. First do this and then continue on.
With your plane selected, use this option to bring in the 30m SRTM dataset.
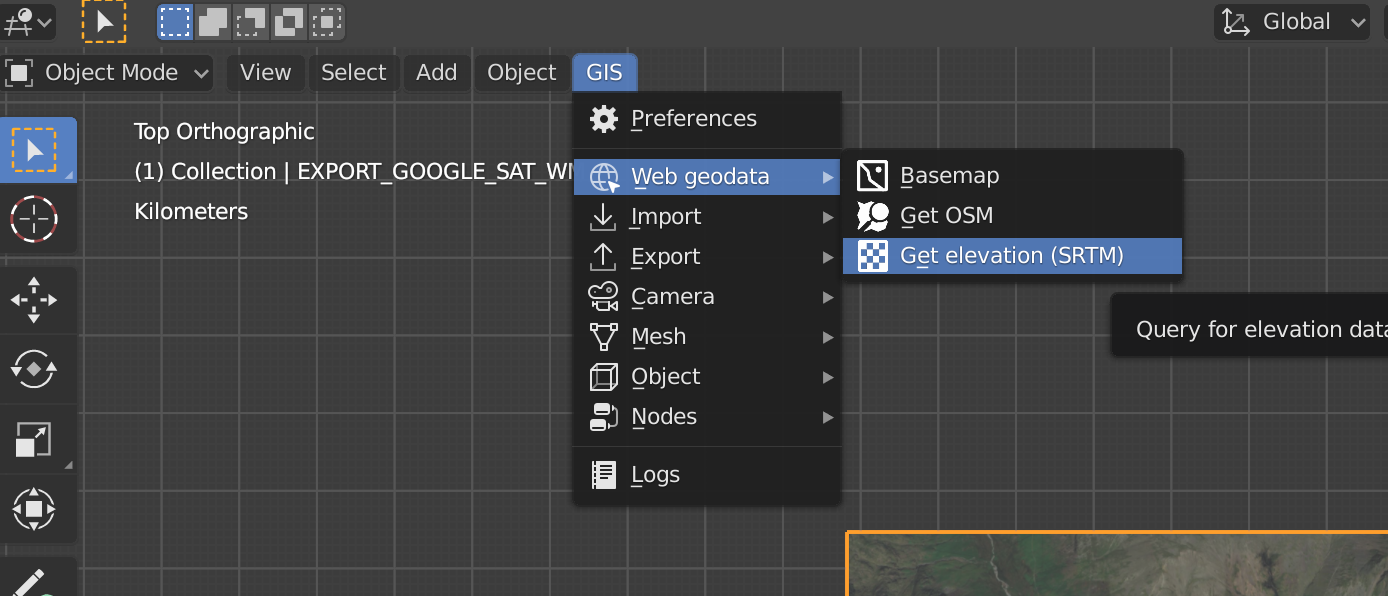
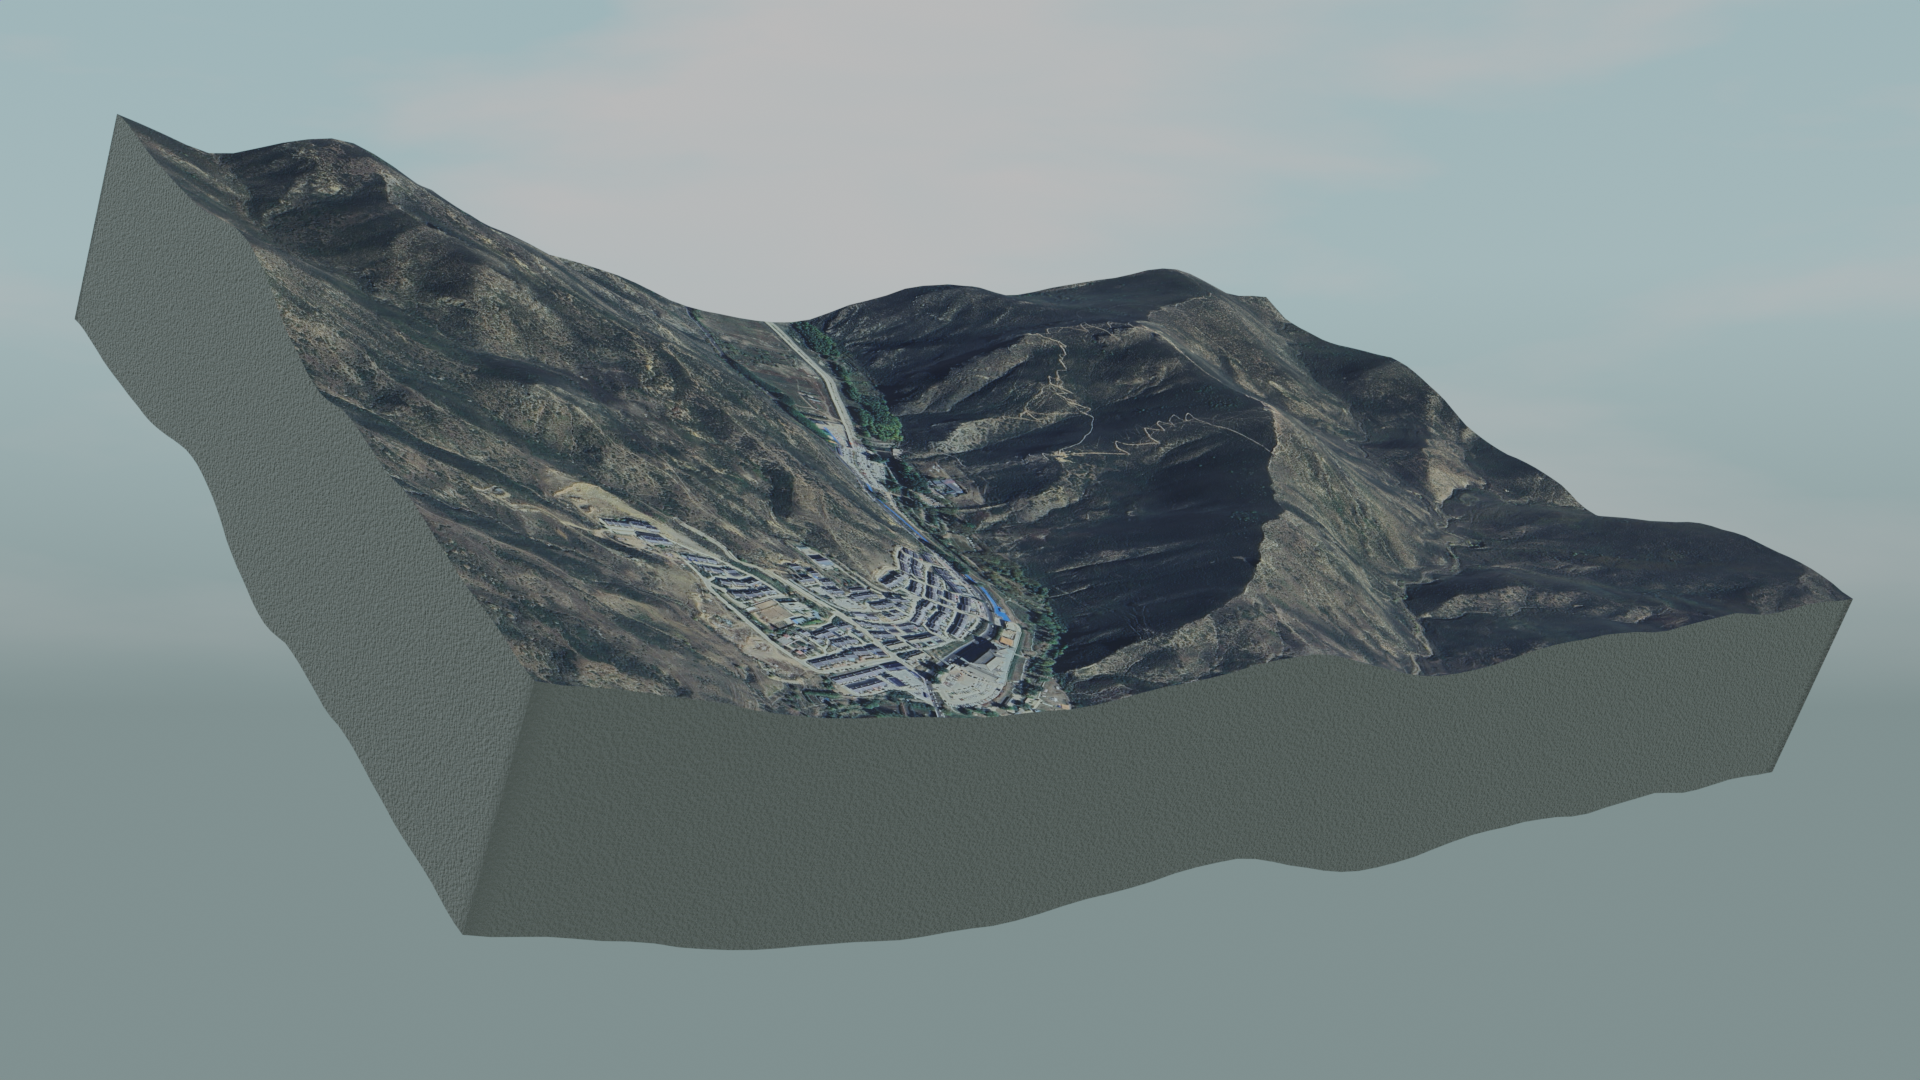
Once this completes (time will vary depending on size of area) you will have a displacement texture applied to the plane that adds relief.
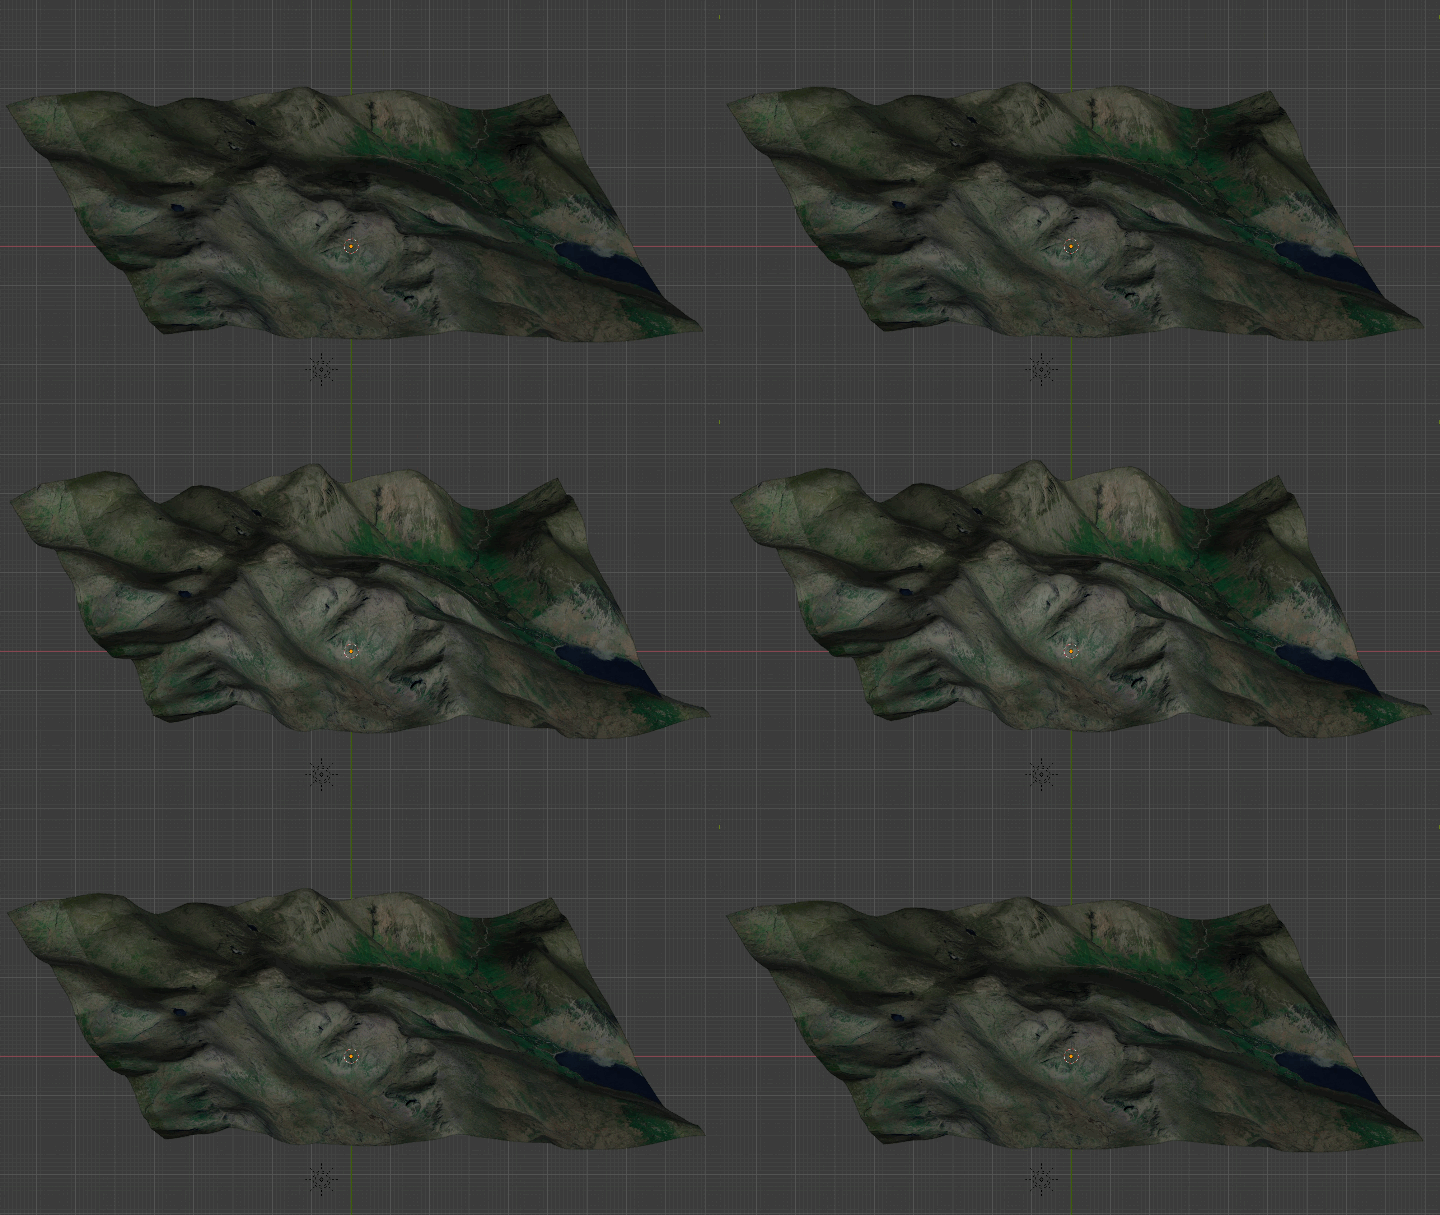
Once you have the 3D data you can play around with attributes such as the scale for virtual exaggeration. This is done in the Object Properties tab. Shown on the right is sliding the Z scale attribute up and down.
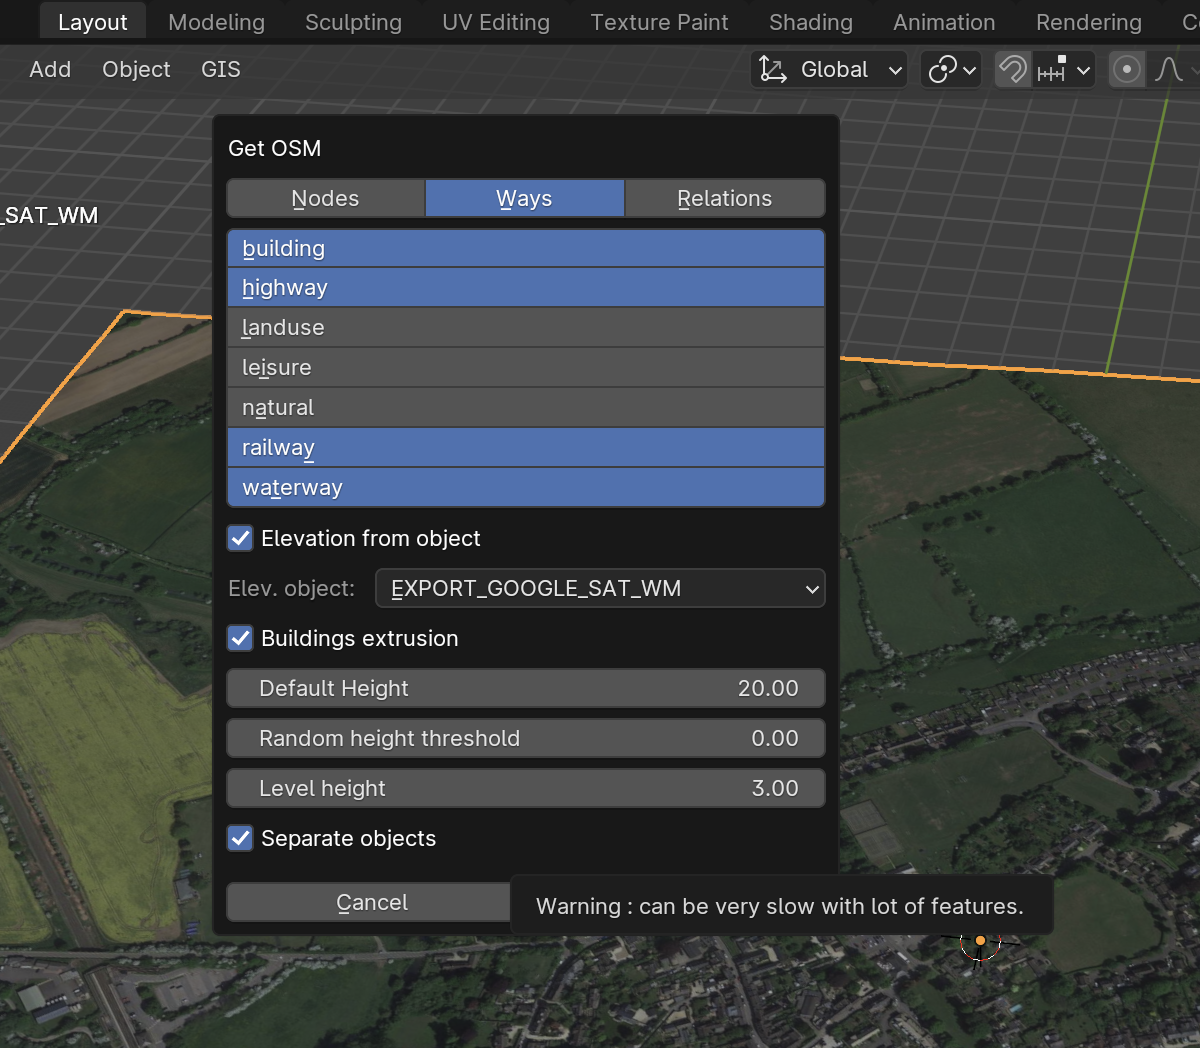
Within the GIS tab and once again into Web geodata, you will see the option for "Get OSM". We can use this to bring in roadways, buildings, waterways etc. from the Open Streetmap data collection.
The data will be brought in as 3D objects based on the location you have chosen. In this example I am bringing in:
